背景
构建Spring Boot应用并上线部署后,其状态随着用户的使用不断变化。因此监控Spring服务状态是每个Spring开发者都需要的功能。如果你是在大公司工作,那么公司内部的框架通常都已经帮你配置了完善的日志+监控系统。但你如果在小公司工作或需要进行独立开发,那自己配置监控系统非常有必要。本文章记录一下我搭建自己的监控系统时所用到的知识以及个人认为的搭建这一套监控系统的最佳实践。
参考资料
基础知识
监控系统的一般构成
一般常见的监控系统,需要包括以下内容:
- 被监控的系统/服务需要暴露一些内部的状态数据指标,供外部监控系统收集
- 收集监测数据能力:拥有具有抓取目标服务数据指标/接受目标服务推送数据指标的能力
- 数据可视化及分析能力:能够可视化展示已收集的数据的能力
- 告警及应急管理能力:当业务某些指标超过预定义阈值时,能反映并通知管理员的能力
在构建Spring监控系统中,常见的组合为如下组合:
- Spring中引入Actuator及Micrometer,提供监测数据查询接口
- Prometheus系统,负责拉取监控数据及定义数据告警
- Grafana系统,负责可视化及查询Prometheus系统中保存的监控数据
Spring中的actuor
Spring Boot Actuator 模块提供了生产级别的功能,比如健康检查,审计,指标收集,HTTP 跟踪等,帮助我们监控和管理Spring Boot 应用。因为暴露内部信息的特性,Actuator 也可以和一些常用的外部的应用监控系统整合(Prometheus, Graphite, DataDog, Influx, Wavefront, New Relic等)。Actuator使用Micrometer与这些外部应用程序监视系统集成。这样一来,只需很少的配置即可轻松集成外部的监控系统。
Micrometer 为 Java 平台上的性能数据收集提供了一个通用的 API,应用程序只需要使用 Micrometer 的通用 API 来收集性能指标即可。Micrometer 会负责完成与不同监控系统的适配工作。这就使得切换监控系统变得很容易。
Endpints
Spring Boot 提供了所谓的 endpoints (下文翻译为端点)给外部来与应用程序进行访问和交互。Actuator提供的所有端点可参考Spring官方文件Spring Endpoints。
控制端点访问的必要性:端点访问几乎可以获取运行的服务中的所有状态,甚至可以控制服务的运行状态等(如shutdown操作)。如服务器运行在公网,并被恶意分子扫描发现了端口,则恶意分子有可能对服务进行任何破坏性操作。因此如果需要暴露端点到公网,对其进行访问控制与保护是非常有必要的
配置端点可访问性
通过如下配置信息,可以通过配置信息控制Spring将哪些Actuor暴露给外部访问
 1
 2
 3
 4
 5
 6
 7
 8
 9
10
|
# 例子:开启所有端点访问
management.endpoints.web.exposure.include=*

# 例子:只开启指定的endpoint,这里是/actuator/beans和/actuator/mappings
management.endpoints.web.exposure.include=beans,mappings

# exclude可以关闭端点访问
# exclude通常和include配合使用。如下例子先include全部端点,再exclude /actuator/beans
management.endpoints.web.exposure.exclude=beans
management.endpoints.web.exposure.include=*
|
端点访问加密(端点保护)
虽然我们可以减少暴露的Actuor端点,但被暴露的端点仍然有被攻击的风险。因此,我们可以通过给端口加上访问限制进行保护。
以下两种方法都能给对应端口加上基本http验证。如果使用浏览器直接访问/actuator对应端口,会弹出401错误,弹窗要求
使用Spring Security保护(推荐)
org.springframework.boot
spring-boot-starter-security
在application.yml中进行配置
1
2
3
4
5
6
|
spring:
    security:
        user:
            name: admin
            password: 123456
            roles: ADMIN
|
配置Security的SecurityFilterChain的例子。SpringSecurity 5.4.x以上新用法配置(旧用法为WebSecurityConfigurerAdapter,已被弃用)
 1
 2
 3
 4
 5
 6
 7
 8
 9
10
11
12
13
14
|
@Configuration
public class ActuatorSecurityBean {

    /**
     * 配置Actuator Endpoints的安全策略,其他请求不受影响
     */
    @Bean
    SecurityFilterChain filterChain(HttpSecurity httpSecurity) throws Exception {
        httpSecurity.requestMatcher(EndpointRequest.toAnyEndpoint())
                .authorizeRequests((requests) -> requests.anyRequest().hasRole("ADMIN"))
                .httpBasic();
        return httpSecurity.build();
    }
}
|
直接编写拦截器进行保护
适合在无法引入Spring Security的情况下使用,一般情况不推荐
新建 BasicAuthIntercepror
 1
 2
 3
 4
 5
 6
 7
 8
 9
10
11
12
13
14
15
16
17
18
19
20
21
22
23
24
25
26
27
28
29
30
31
32
|
@Slf4j
public class BasicAuthInterceptor implements HandlerInterceptor {

    // todo: remember to modify the password or use outside values
    private final static String BASIC_AUTH_USER_NAME = "admin";
    private final static String BASIC_AUTH_PASSWORD = "123456";

    @Override
    public boolean preHandle(HttpServletRequest request, HttpServletResponse response, Object handler) throws Exception {
        String authHeader = request.getHeader("Authorization");
        if (authHeader != null && authHeader.startsWith("Basic ")) {
            String base64Credentials = authHeader.substring(6);
            String credentials = new String(Base64.getDecoder().decode(base64Credentials), Charset.forName("UTF-8"));
            final String[] values = credentials.split(":", 2);

            if (isValidUser(values[0], values[1])) {
                return true;
            }
        }

        log.warn("Unauthorized access attempt from IP {} for URI {}", request.getRemoteAddr(), request.getRequestURI());
        response.setHeader("WWW-Authenticate", "Basic realm=\"example\"");
        response.sendError(HttpStatus.UNAUTHORIZED.value(), HttpStatus.UNAUTHORIZED.getReasonPhrase());
        return false;
    }

    private boolean isValidUser(String username, String password) {
        return BASIC_AUTH_USER_NAME.equals(username) &&
                BASIC_AUTH_PASSWORD.equals(password);
    }

}
|
再编写ActuatorConfig.java
 1
 2
 3
 4
 5
 6
 7
 8
 9
10
11
12
13
14
15
16
17
18
19
20
21
22
23
24
|
/**
 * 为Actuator配置拦截器,如未使用Actuator则不启用
 */
@Configuration
public class ActuatorConfig extends WebMvcEndpointManagementContextConfiguration {

    private BasicAuthInterceptor authenticationInterceptor = new BasicAuthInterceptor();

    @Override
    public WebMvcEndpointHandlerMapping webEndpointServletHandlerMapping(WebEndpointsSupplier webEndpointsSupplier,
                                                                         ServletEndpointsSupplier servletEndpointsSupplier,
                                                                         ControllerEndpointsSupplier controllerEndpointsSupplier,
                                                                         EndpointMediaTypes endpointMediaTypes,
                                                                         CorsEndpointProperties corsProperties,
                                                                         WebEndpointProperties webEndpointProperties,
                                                                         Environment environment) {
        WebMvcEndpointHandlerMapping mapping = super.webEndpointServletHandlerMapping(
                webEndpointsSupplier, servletEndpointsSupplier, controllerEndpointsSupplier,
                endpointMediaTypes, corsProperties, webEndpointProperties, environment
        );
        mapping.setInterceptors(authenticationInterceptor);
        return mapping;
    }
}
|
接入流程
我们选择一个基于Spring Boot的应用,作为改造目标
我们的最终目标是:
- 对目标服务的接口指标进行监控,如接口的qps、响应时间、Error数量等
- 对目标服务内部情况进行监控,如进程内存空间、线程池情况等
- 对JVM性能及内存情况进行监控
- 统一展示上述指标,并配置关键信息的告警
假设Spring Boot程序,Prometheus,Grafana都运行在localhost
引入Spring Boot依赖
在Spring项目的maven中加入如下dependency
 1
 2
 3
 4
 5
 6
 7
 8
 9
10
|
        <!--监控-->
        <dependency>
            <groupId>org.springframework.boot</groupId>
            <artifactId>spring-boot-starter-actuator</artifactId>
        </dependency>
        <!-- 集成micrometer,将监控数据存储到prometheus -->
        <dependency>
            <groupId>io.micrometer</groupId>
            <artifactId>micrometer-registry-prometheus</artifactId>
        </dependency>
|
在配置文件application.yml中加入如下配置,使暴露的端点中只有prometheus可以被访问
1
2
3
4
5
6
7
8
|
management:
  endpoints:
    web:
      exposure:
        include: 'prometheus'
  metrics:
    tags:
      application: ${spring.application.name}
|
默认的prometheus端口暴露即可展现许多有效参数,基本满足了我的需求。当然,spring的Actuator支持自定义配置端口暴露自定义参数,有需要的可以自己去配置
配置 Prometheus 监控应用指标
修改 prometheus.yml 配置
1
2
3
4
5
6
|
scrape_configs:
  - job_name: 'spring-boot-application'
    metrics_path: '/actuator/prometheus'
    scrape_interval: 15s # 可根据需要进行调整
    static_configs:
      - targets: ['localhost:8080']
|
使用Grafana可视化指标
- 启动 Grafana ,并在浏览器上打开 http://localhost:3000 访问其 Web 界面。
- 在 Grafana 的用户界面中导航到 “Configuration” > “Data Sources” > “Add data source”,将 Prometheus 添加为数据源。选择
- Prometheus 作为类型,并指定运行 Prometheus 的 URL,通常是 http://localhost:9090。
- 保存并测试,确认 Grafana 可以成功连接到 Prometheus。
看板配置
Grafana中可以倒入其他人已经配置完毕的监控面板
这里的有几个我常使用的面板模板
在Grafana中操作时,点击Add,然后选Import模式,填入模板的ID,并选择刚才添加到Prometheus。Grafana就会从官方模板库中拉取对应的监控面板,启动后就能看到对应的监控页面,例如倒入第一个面板12856后就能看到
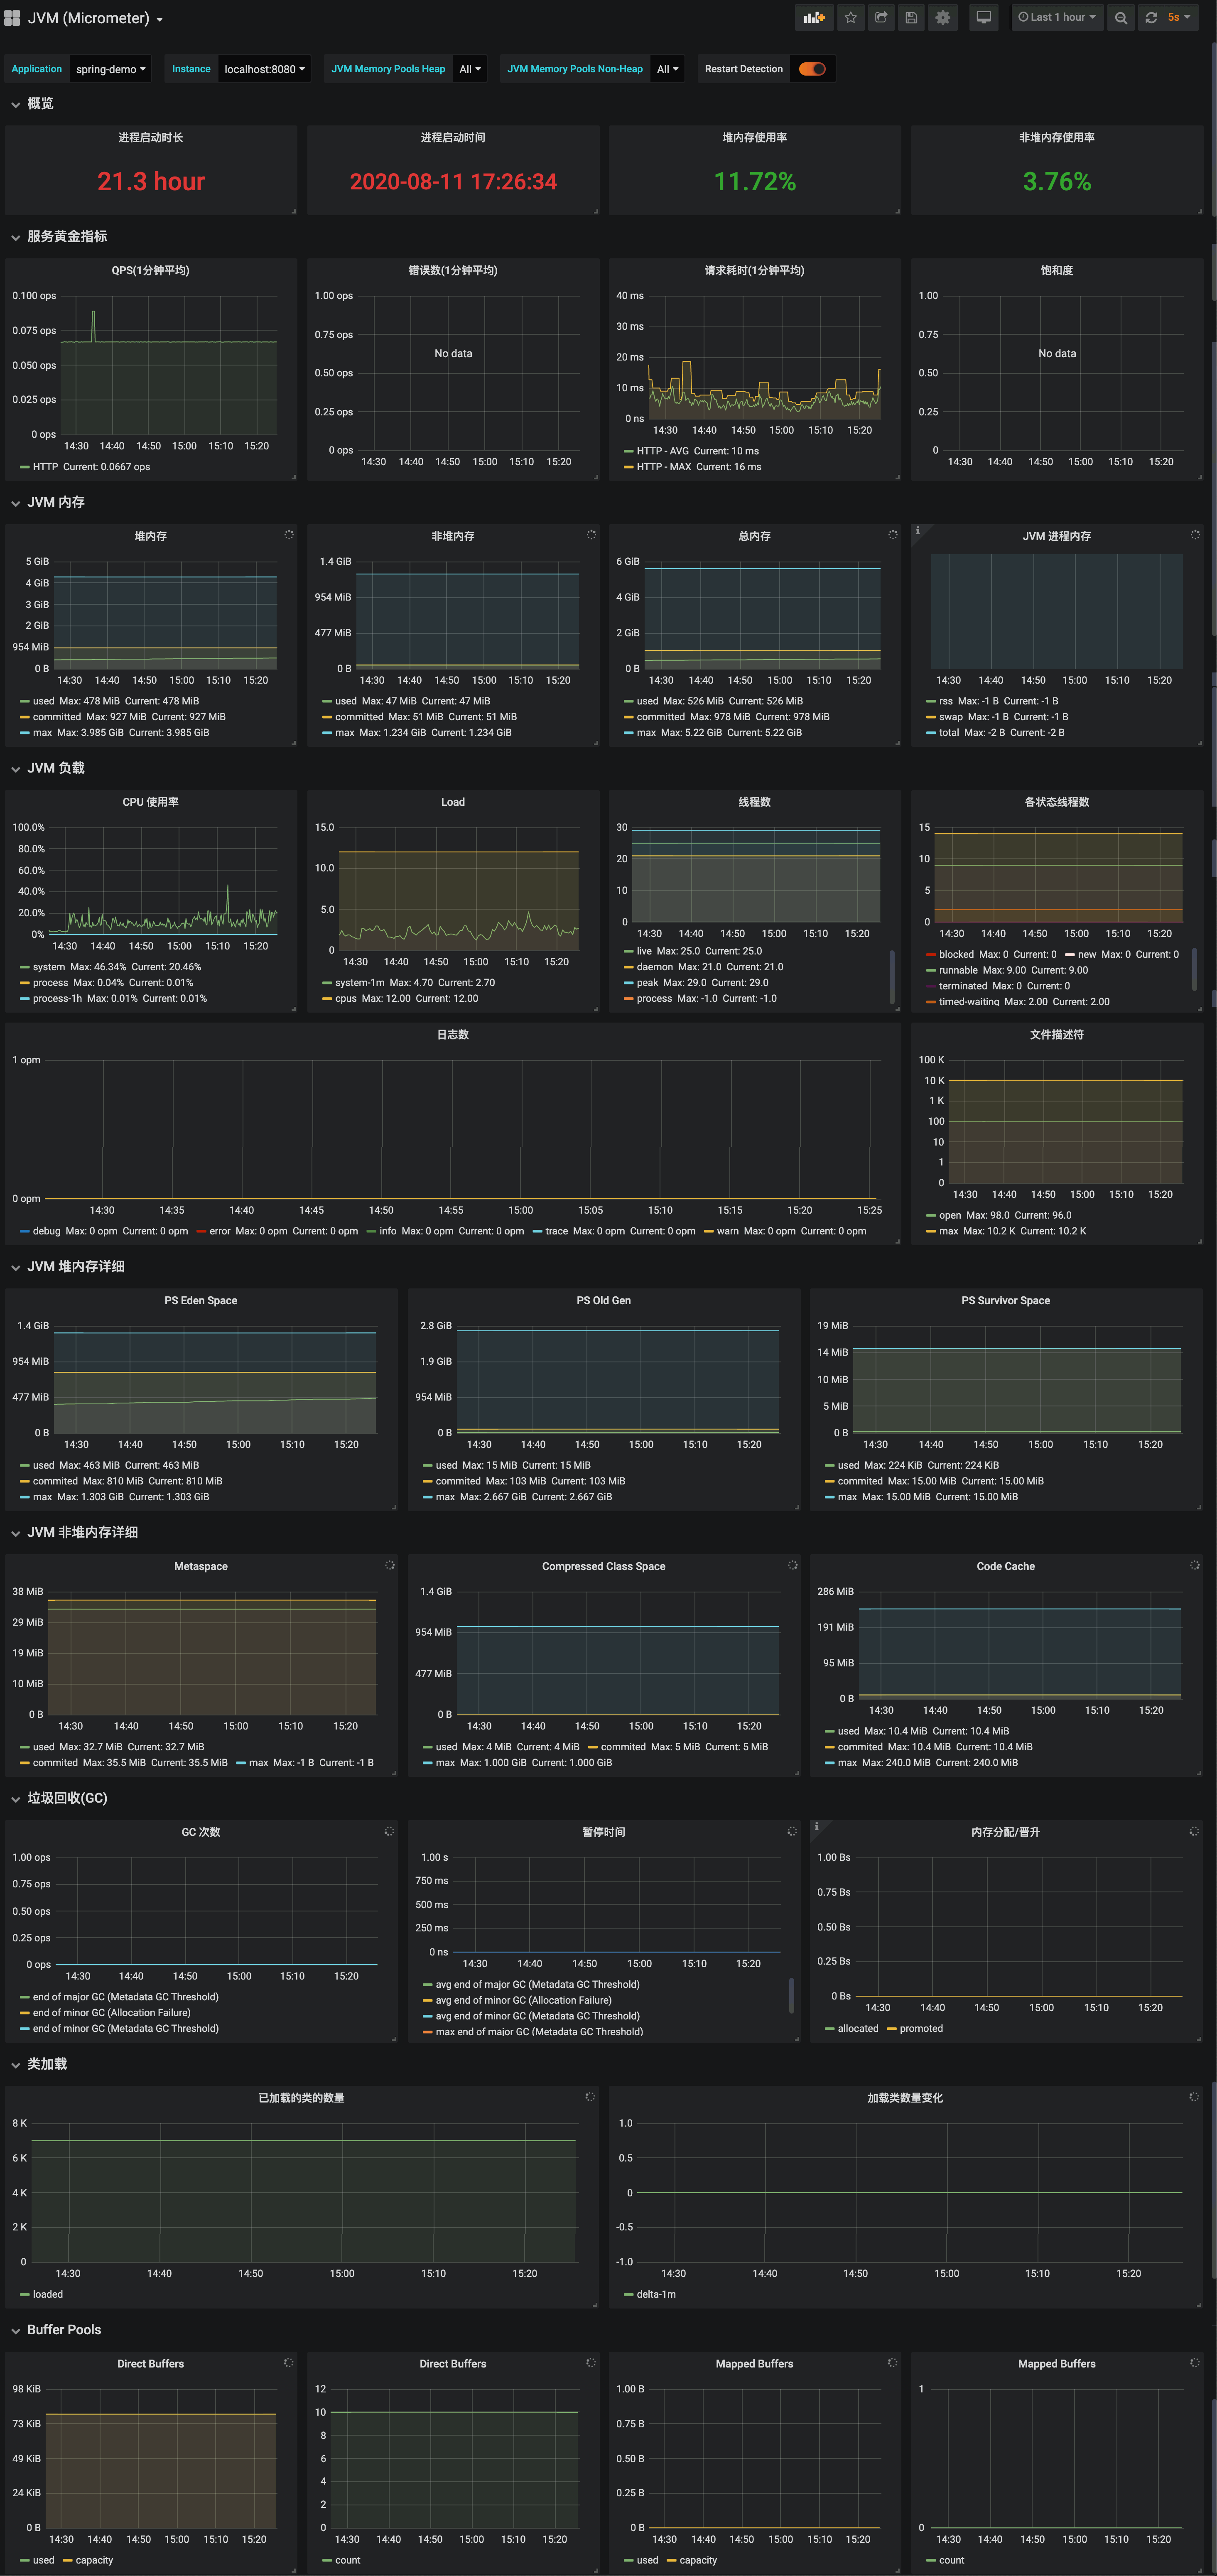
这几个模板中,默认已经提供了服务指标,JVM内存,JVM负载,GC情况等等关键指标。已经足够满足大部分常用情况
自定义指标
当然,我们也会遇到一些需要的指标没有到情况。比如我比较喜欢根据服务的uri分类接口,让监控面板只显示某个接口的指标参数。我们可以通过学习Grafana以及Prometheus查询语法的方式,自定义面板。
以12856这个面板为例,Settings/Variables中已经定义了application和instance变量,会读取Prometheus中已经在运行的application作为变量,在面板中区分不同的application。但我想根据uri监控不同的端口,因此需要对目前的监控面板进行修改。
添加变量
点击增加按钮,增加一个变量。在Query Options中选择Data source为Promethus。Query中填入
1
|
label_values(http_server_requests_seconds_count{uri!="/actuator/prometheus", application="$application"}, uri)
|
回到监控页面,就能发现上方的选项卡中增加了一个选项,可以根据uri区分。
增加Panel
只增加了变量还不够,默认的模板中的监控只能以Application为粒度进行区分,因此还需要增加新的监控面板。点击add panel,选择Prometheus。输入Query即可增加监控Panel
以下是一些我总结的监控面板查询语句:
 1
 2
 3
 4
 5
 6
 7
 8
 9
10
11
12
13
14
|
<!-- 所有接口一分钟内总访问量 -->
sum(increase(http_server_requests_seconds_count{application="$application",uri!~"/actuator.*|/prometheus.*"}[1m] ))

<!-- 每个接口的QPS -->
sum(rate(http_server_requests_seconds_count{application="$application", instance=~"$instance", uri=~"$uri"}[1m])) by(uri,method)
标签legend填入{{method}} - {{uri}} - {{status}}

<!-- 接口一分钟内总访问量 -->
sum(increase(http_server_requests_seconds_count{application="$application", instance=~"$instance", uri=~"$uri"}[1m])) by(uri,method)
标签legend填入{{method}} - {{uri}} - {{status}}

<!-- 一分钟内接口的最大相应时间 -->
max(http_server_requests_seconds_max{application="$application", instance="$instance", uri=~"$uri", status!~"5.."})by(uri,method)
标签legent填入{{method}} - {{uri}} - {{status}}
|
总结
以上就是一些个人在搭建Spring服务时遇到的问题及经验总结。记录以供下次使用